
Thermodynamics: States of Matter
- Mole
- Gas Volume
- States of Matter 🢀
- Heat
- Enthalpy
- Thermodynamics
- Adiabatic Process
- Mass Energy Conservation
- Carnot Engine
<P, v, T> diagram
Matter appears in three possible states (phases): solid, liquid and gas. (The forth state 'plasma' or 'ionized gas' is not considered here.) The state is fully characterized by the state variables: P (pressure), V (volume) and T (temperature). Since the volume depends on the mass we usually consider 'specific' volume v which is the volume of 1 kg matter. The possible states of a particular substance represent a surface in the 3D space <P, v, T> as it is shown below:
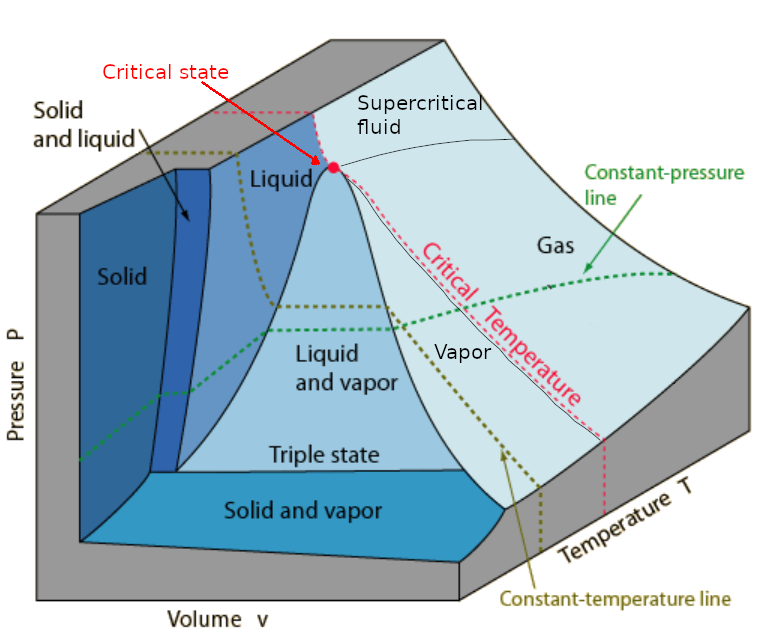
There are regions with only one state and regions in which two states coexist. The liquid and vapor region is called the '(saturation/vapor) dome' because it has the shape of a dome. The boundary between the dome and the liquid region ends at the 'critical state'. If the temperature is greater than the critical temperature the vapor cannot be compressed to liquid any more. The 'triple state line' is the only region in which all three states appear simultaneously. The light blue region represents the gaseous state that can be subdivided into: vapor, (superheated) gas and supercritical fluid.
<P, T> diagram
The projections of the 3D diagram to 2D diagrams are also very useful even if some information of the <P, v, T> surface is lost. The PT diagram shows phases at a specific constant volume and is illustrative for phase transitions:

The whole solid/liquid region of the 3D diagram collapses into the green line which is just the boundary between the solid and liquid phases. The full green line is typical for the most substances that expand at melting and shrink at freezing. The dashed green line represents the anomalous behaviour of water: ice is lighter that liquid water.
The whole liquid/vapor region ("dome") of the 3D diagram collapses into the blue line which is just the boundary between the liquid and vapor (gas) phases. This line start at the triple point which is the projection of the triple line. The line ends at the critical point. Beyond this point gas and fluid cannot be distinguished.
<P, v> diagram
The Pv diagram is usefeful in thermodynamics because the product P ⋅ v corresponds to work (energy).
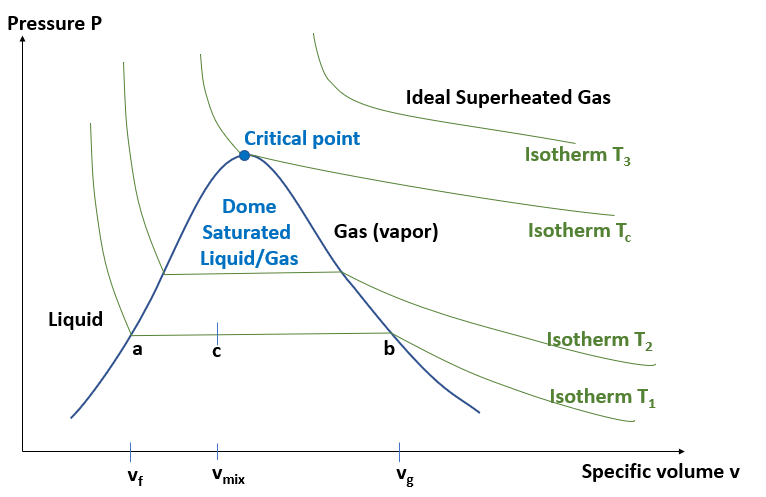
The figure shows the saturated dome below the blue line and the critical point. There are several isotherms shown, that are curves with constant temperature. The higher an isotherm lies the higher is the temperature. The isotherms in the liquid region left to the critical point are very steep because fluids are almost incompressible. The isotherms in the gas region right or above the critical point follow the ideal gas law P v = constant. The isotherms inside the saturated dome have not only constant temperature but also constant pressure.
Let us consider the isotherm T1. The point a corresponds to 100% saturated liquid at specific volume vf ('f' = fluid), the point b corresponds to 100% saturated gas (vapor). At some point c between a and b we have a mixture of liquid and gas with the following properties:
| mixture | mass | volume | specific volume |
|---|---|---|---|
| fluid | mf | Vf | vf |
| gas | mg | Vg | vg |
| mixture | mmix | Vmix | vmix |
| mixture | fluid |
|---|---|
| mass | mf |
| volume | Vf |
| specific volume | vf |
| mixture | gas |
| mass | mg |
| volume | Vg |
| specific volume | vg |
| mixture | mixture |
| mass | mmix |
| volume | Vmix |
| specific volume | vmix |
The relative content of gas in the mixture is called the 'quality' x of the vapor:
mf + mg
Notice that x(a) = 0 and x(b) = 1 and x increases linearly from a to b because of the conservation of mass: the mass of fluid is converted to the same mass of gas. For any value of x ∈ [0, 1] we have:
mmix
mf + mg
References
- Behavior of Two-Phase Systems (MIT script)
- Quality by Scott W. Campbell